Visualizing Operations & Ingestion KPIs
Management cannot optimize what it does not measure. We design dashboard panels that link directly to database updates and query records, providing immediate visibility into data ingestion timelines, workflow stages, and query costs. This replaces fragmented sheets with verified live reports.
We log query metrics across model providers dynamically, showing prompt cost efficiencies. A dashboard tracking cost-per-query compares high-throughput runs (using Gemini 1.5 Flash) with complex reasoning tasks (using Claude 3.5 Sonnet or GPT-4o), warning operations directors of any cost anomalies.
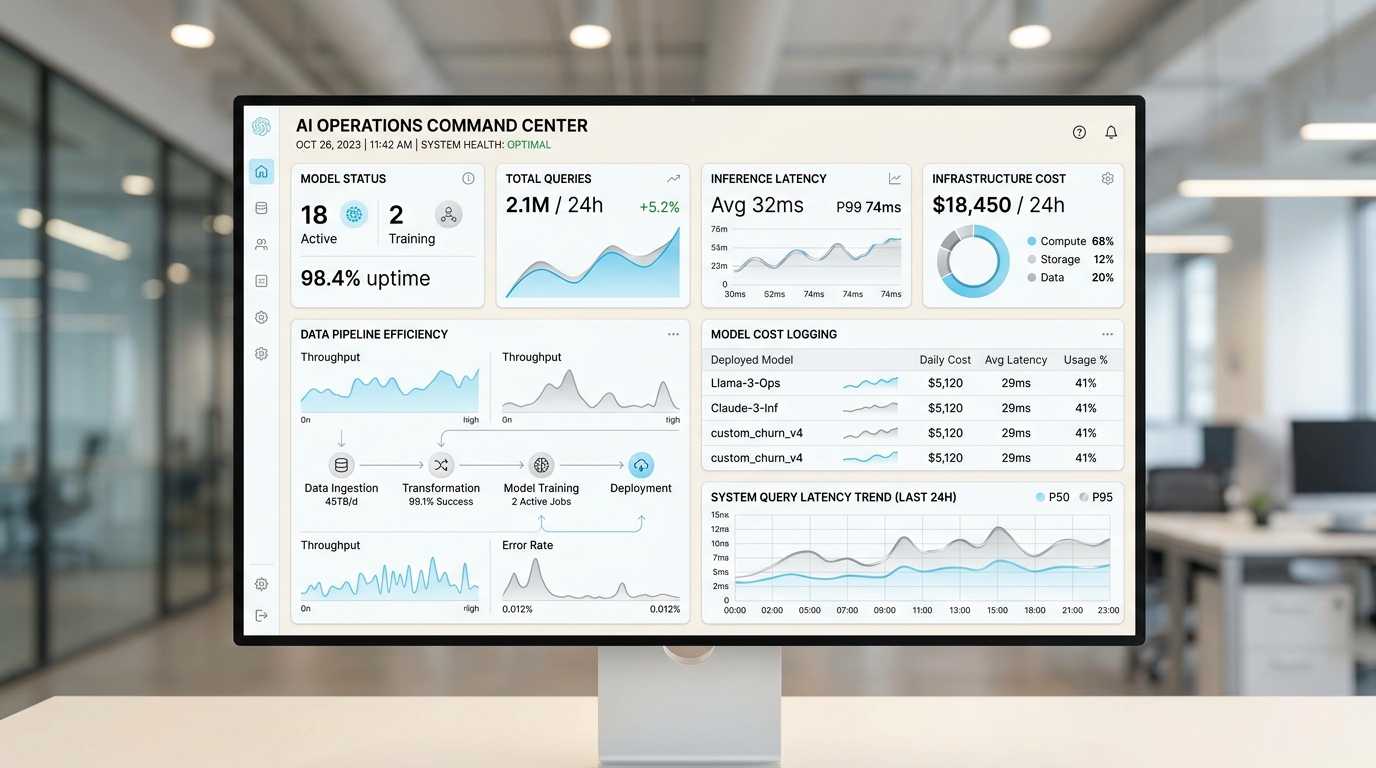
Model Latency & Cost Logging Benchmark (Indicative)
Our dashboards track model runs and query metrics to optimize pipeline costs and response times:
| Model Applied | Cost / 1M Input Tokens | Cost / 1M Output Tokens | Query Latency (Avg) | Target Task Placement |
|---|---|---|---|---|
| Gemini 1.5 Flash | $0.075 | $0.30 | ~300ms | High-speed data ingestion and structured JSON mapping |
| Claude 3.5 Sonnet | $3.00 | $15.00 | ~1.2s | High-reasoning, contract audits, and complex RAG queries |
| GPT-4o | $2.50 | $10.00 | ~800ms | Real-time chat routing and event-trigger classifications |
| Llama 3.1 8B (Local Host) | Infrastructure Cost Only | Infrastructure Cost Only | ~150ms | Sensitive local database edits and telemetry sanitation |
Three Dashboard Levels We Configure
1. Data Ingestion Dashboards
Logs Postgres well data updates, scraping logs, and index commits, showing telemetry success rates and database write times.
2. Model Cost Monitors
Tracks monthly API dollar costs, tokens spent, cache hit rates, and query latency across different department roles.
3. Operator Staging Gates
A simple human-in-the-loop review board showing items pending approval, complete with side-by-side comparison tables.